Status Page
Welcome to Upzilla’s uptime monitoring service, where we provide comprehensive monitoring solutions to ensure the reliability and performance of your websites. In this section, we’ll explore the features of our hosted status page, offering insights into its capabilities and functionality.
Our hosted status page serves as a centralized hub for monitoring checks, providing users with real-time insights into the status and performance of their websites. Let’s delve into the key functions and features of our status page:

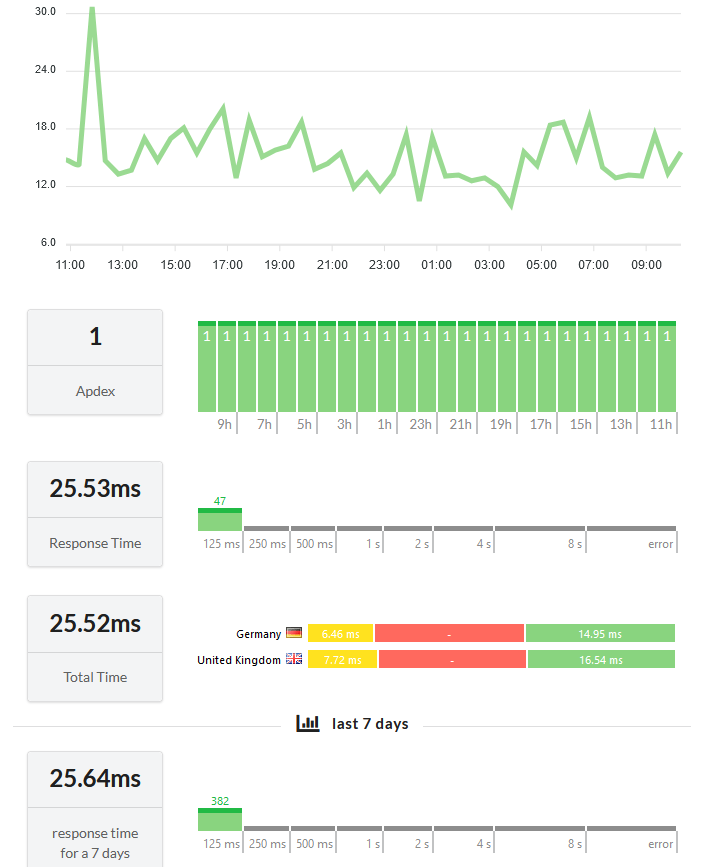
The status page displays the current status of each monitoring check, along with general statistics on uptime for the last 24 hours. Users can quickly assess the overall health of their websites and identify any issues that require attention.
In addition to monitor status, the status page presents current timeouts across various metrics, including namelookup and response time. This detailed insight allows users to pinpoint areas of concern and troubleshoot performance issues effectively.
Users have access to logs and analytics for different time periods, including the last 24 hours, the last 7 days, the past month, and the last 6 months. This historical data enables users to track performance trends over time and make informed decisions to optimize website reliability.
The status page provides an hourly APDEX (Application Performance Index) rate for each monitor, offering a standardized metric for evaluating performance quality. Users can gauge the overall user experience and identify opportunities for improvement.
To enhance data visualization, our status page offers visual charts for different report parameters, such as uptime, response time, and timeouts. Additionally, users can view data split by different monitoring geolocations, providing insights into regional performance variations.
Upzilla’s hosted status page offers a comprehensive overview of website performance, empowering users with real-time insights, historical analytics, and visualizations to optimize uptime and user experience. By leveraging the features of our status page, users can proactively monitor their websites, identify potential issues, and ensure uninterrupted digital presence. If you have any questions or require assistance, please don’t hesitate to reach out to our support team.